Solar activity graph over the last 400 years
F10.7, sfu (10-22W/m2/Hz)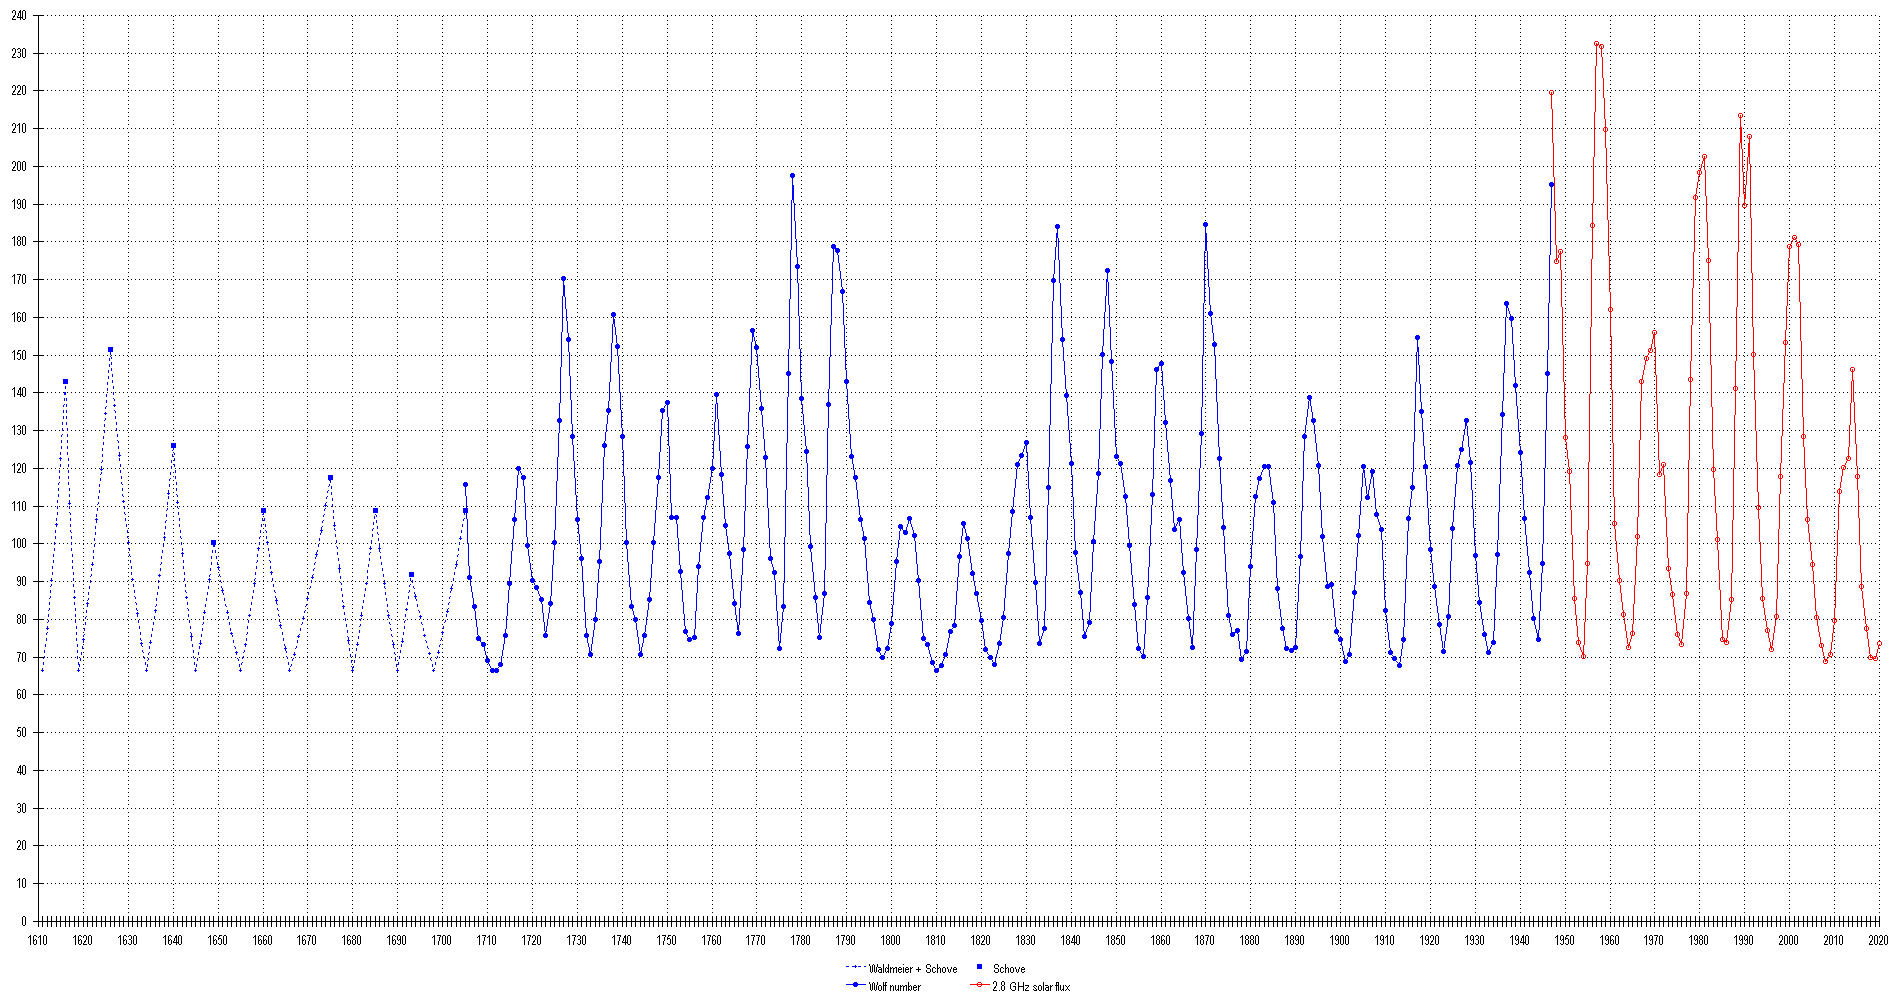
Spectral intensity of solar energy flux d∕dν (dP∕dS) is measured at a wavelength of 10.7 cm since year 1947. It is used as one of the solar activity indexes – F10.7 (10.7-cm [Radio] Flux).
In earlier years only one (indirect) method of the solar activity estimating was used – sunspot number counting. – Relative sunspot number (Wolf number, W) is another (old) solar activity index.
For years before 1947 F10.7 is calculated here from the relative sunspot number (for the XVII century – just from the number of sunspots).